The Art of IT Debugging & Troubleshooting: a Cheesy approach

Hey everyone! I'm a data engineer & an Elastic Certified based in France. My main stack is Elastic and Kubernetes, here to learn and share :)
This blog post participated in the #DebuggingFeb writeathon, and secured the runners up place :) !
Introduction
As an IT professional, whether you're a data engineer, scientist, or web developer, you've undoubtedly encountered challenging debugging problems in the past. Unfortunately, this is only the beginning as you will face many other bugs in the future that will need troubleshooting and debugging, and you have to understand the reasons and solutions to fix them. In this perspective, troubleshooting is not a random process where you test numerous configurations until the problem is resolved. It's more than that; it's a mindset that you learn by fixing bugs!
This leads us to several questions: How do you troubleshoot effectively? Are there any frameworks or tools that can aid in the debugging process? What is the process to follow?
In this blog, I will share with you what I have learned over the last four years, as well as the approach you can apply to your IT work regardless of the programming language you use. This is not debugging specific to a particular language, such as Java or Python; it's a general approach that you can implement in any IT problem.
OHER
Pronounced "OH-ER" is a principle that one of my teachers talked about when I was a student! I tried to find a reference about it on the internet and couldn't, if you already know it and have a reference about: a book or something talking about this principle, let me know in the comment.
Now, when we face a problem to troubleshoot or debug to find a solution, we have two possibilities:
We go to Google and type the error message and, hopefully, we find the solution on stackoverflow, github, etc.
Or, we can't find any on google, then we gotta find it ourselves!
Post your problem on stackoverflow, github, etc.
You can opt for option 3 but I highly encourage you to try to figure out debugging on your own, because trust me whether you succeed or not resolving it, you learn a lot of things all the way long, it's worth it! Personally, whenever I face a problem, I give couple of hours or even days to fix it on my own, by reading carefully the error message, the trace back error and reading the documentation with very high attention to not miss any detail. However, once you find the solution on your own, you get more confident in your role :D
In step 2, the framework to use is OHER, which stands for Observation, Hypothesis, Experiment, and Result.
Observation
Once you have an error in front of you, you need to start with the observation part. This involves collecting data such as the error message, the line of code in which the error occurred, the type of error, and the component that is affected, such as an API or database. By repeating the same error multiple times, you can confirm that the system is indeed failing, but the origin of the failure is still unknown.
In this first step, it's important to be able to reproduce the error. You can isolate your component and run it in a separate environment (from your VM to localhost) to see if the bug is still present. If the bug disappears in the separate environment, it's likely that the environment where your component is running is affected, which is causing the failure.
Before going further in this blog, based on my experience, it's a good idea to read the official documentation when you encounter a bug. Sometimes, I find answers in the documentation that can help fix the problem. I know that when reading documentation, we often jump straight to the code snippets, but it's a mistake we tend to make. 😉

Hypothesis
Once you have completed the first step, which is "Observation", you can begin making hypotheses about the root cause of the issue. For example, if you are debugging a python project that uses an external API but fails, some possible hypotheses could be:
are you using HTTPS or HTTP, if using HTTPS is your CA trusted? if not is
verify_certset tofalse?is CORS configured well? did you add your host to the
Access-Control-Allow-Originheader?are you passing a date in your API call, does the API accept a certain format of date? if so which format?
in case you are using a corporate network, did you ask the network administrator if there is a network firewall? If so there might be a proxy to be used, and asking for it may resolve the connection problem, making the API call work.
Did you copy and paste a code snippet from a forum? If so did you check the documentation and the version you are using? Because sometimes we copy answers from StackOverflow posted many years ago but we are using a recent version, the reason could be simply an outdated code and we only have to check the official documentation to get the new version.
and many more...
Another thing to mention is, if the piece of code was running before and now it's broken, you may also check your git logs, and see if there are some recent commits pushed to the branch where you are working. Sometimes it could be a conflict between version packages, or someone in your team did a minor upgrade of a library that affect your script.
Once you are done with listing all hypotheses it's time to validate each one!
Experiment
In this step, you proceed to test and experiment with each hypothesis. Using the previous example, you can perform the following actions for each hypothesis:
to avoid any HTTP issue: most of the time I start by replacing HTTPS with HTTP to make sure I will not have any TLS issues. If it worked meaning that previously my HTTPS was not well-configured in the first place!
CORS: most of the time I just run the code in my localhost and mockup any external API
For date-related API calls: check the date format used or the time zone passed as it may not be supported, is unknown or there may be a daylight problem.
proxy: you may ask one of your colleagues if he/she knows what's the URL proxy used. In general, you have to set one of the environment variables (
HTTP_PROXYorHTTPS_PROXY) and set it to the proxy URL value
Results
When experimenting with each hypothesis and testing it, you analyze the results based on the output and see if the issue is resolved or not. If the results are not what you're looking for, you iterate over the hypothesis step and come up with new ones, experiment with them, and then analyze the results again. It's a cycle that involves these three steps - hypothesis, experiment, and results - until the bug is fixed. The following diagram shows the lifecycle:

Now we know the framework of how to resolve and troubleshoot a bug, but in a complex system when it's running a production environment, how to debug and troubleshoot a failure in a part of a whole architecture? The answer is in the next section!
Swiss Cheese model
Imagine you have a complex architecture already deployed in production and being used daily by many users. The application is meeting your SLA (Service Level Agreement), but perhaps some user requests are failing, either due to a component in your architecture system or an external service you are using. This is where debugging and troubleshooting come into play: to find the root cause and the failed component to be fixed!
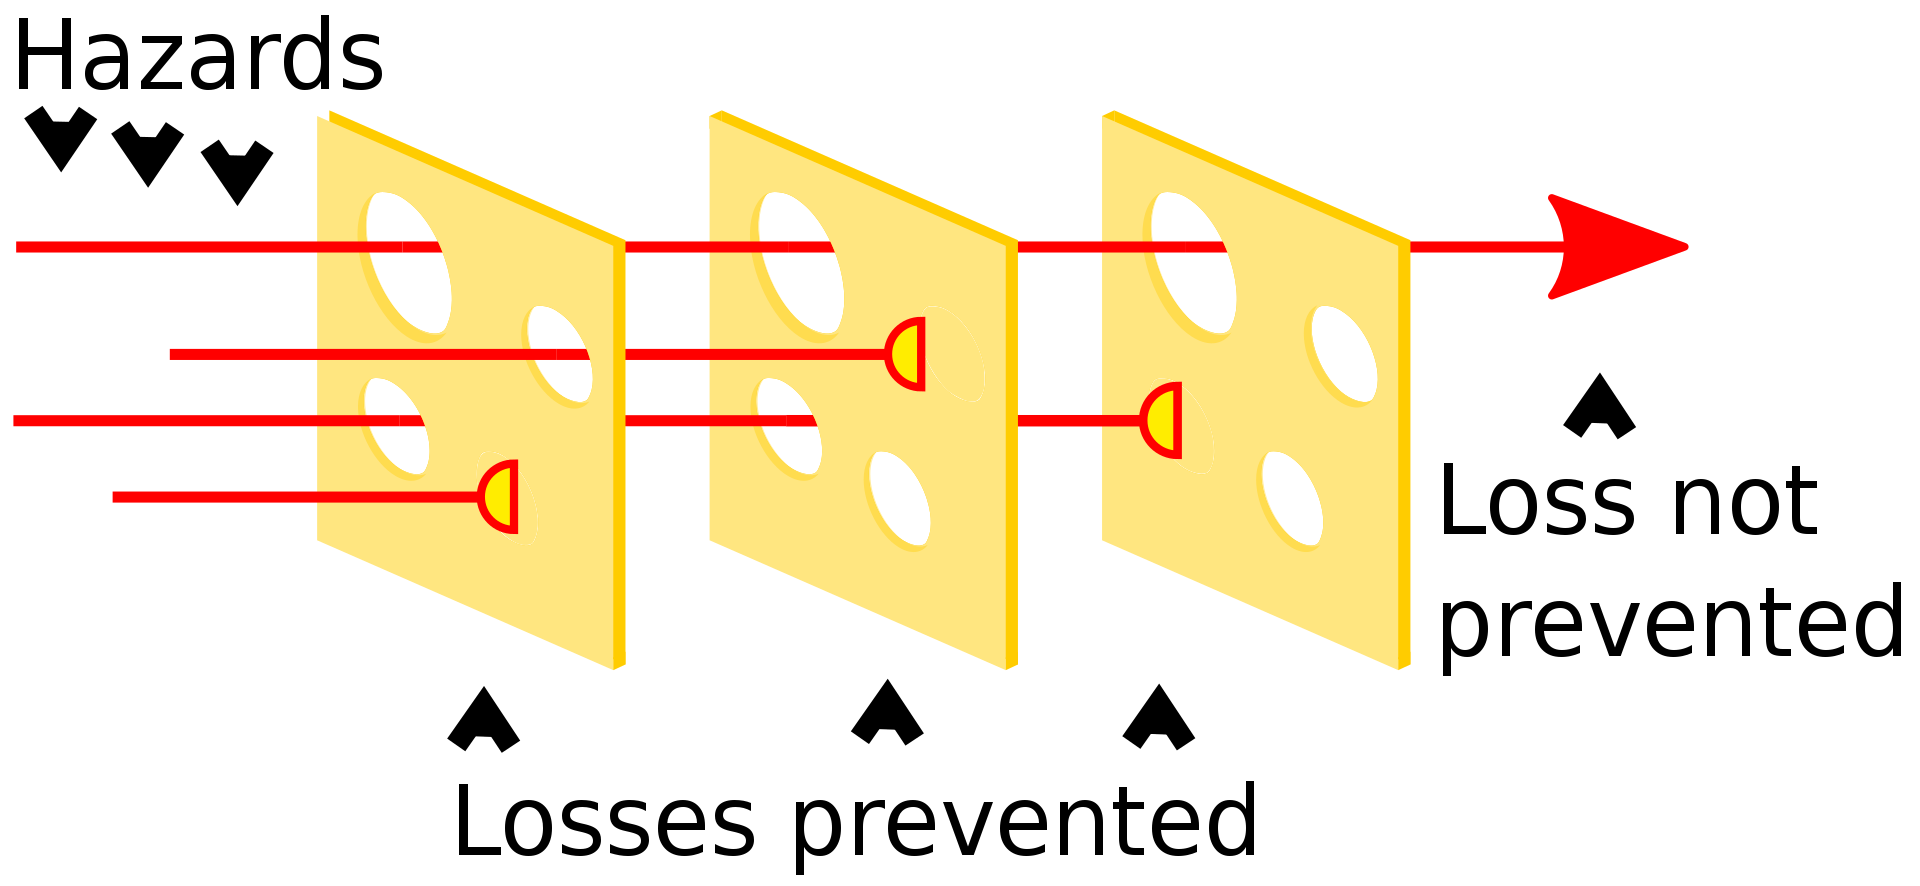
This can be interpreted using the Swiss cheese model, which is a metaphor to visualize how a system can easily fail. In a given system, each component (slice cheese) plays its role as a barrier preventing some losses. However, each component has its weaknesses, or "holes", meaning each component in the system has some unintended weaknesses, but sometimes the holes in each slice can be aligned perfectly leading to a failure in the system (see picture below).
Thus, if a part of a complex architecture fails, the root cause could be the component that failed or a preceding component in the chain.
With the same analogy, let's take for example this architecture from Microsoft doc (I picked a random one from the internet):

As you can see there are many components, each one doing its specific job (some components are collecting raw data, some of them transfer it, enrich it, etc.) to answer a business need. Now in the case of a failure in one of the components (ex: a failure in PowerBI not showing some data), person A can say: "Perhaps there is a problem in PowerBI we need to check the dashboards?", or person B can say: "Maybe the pipelines in Azure synapse are failing a case which can lead to not processing some data further to PowerBI?", or person C can say: " I think the API we are using to retrieve some data they migrated to a new version, we have to check logs to confirm it!", etc.
In some cases, it can be challenging to identify the root cause of a failure, such as determining whether the issue was caused by Spark or Kafka. This is because errors can propagate across multiple slices or components, leading to an error being raised in an unexpected place. Therefore, when troubleshooting a failure, it's not sufficient to investigate only the component where the issue appears (such as PowerBI in the previous example), but also to examine the components that come before it in the system chain, such as Spark, Azure Data Lake, and pipelines. Each of these components is expected to act as a barrier to prevent any loss from occurring, as represented by the Swiss Cheese model.
Debugging in production environment
To overcome the complexity of debugging in a production environment, some tools exist, like APM (Application Performance Monitoring) part of the Observability eco-system, there are many APM solutions like Elastic, Dynatrace, and many more, and also an agnostic solution which is OpenTelemetry.
The idea here about APM is to have a 360-degree view of your system and communication between components to track any issue in near-real-time. This allows you to create alerts and monitor them in a way that provides a bird's eye view of your transactions and traces between all services and components. The following picture shows what it looks like when using Elastic APM:

You can view fine-grained details of a transaction:

and also capture errors and view the details about it:

You can play with it from the official elastic demo.
Finally, It's also important to have a good understanding of the system architecture in order to troubleshoot effectively. Meaning having a solid grasp of how each component interacts with one another and how data flows from the start until the end of the chain. By understanding this, you can quickly and easily identify potential points of failure and narrow down your debugging efforts.
Tools & tips
When troubleshooting, there are several tools you can use:
You can ask ChatGPT, it can give you very accurate answers. By the way, you can check my post where I used ChatGPT with Elastic to automate and debug errors!
If a program or a framework exists in docker version, it's a better choice to use docker, at least you'll avoid version conflict and any setup-related problems!
If you are developing in an IDE, most of them offer some options to help you debug, each IDE has its features, go ahead and check them from the official documentation
Logging: is a way to capture information about what your program is doing as it runs. You can use the logging level to record errors, warnings, and other information, which can be helpful when troubleshooting issues.
Tracing tools like Jaeger, Zipkin, and OpenTelemetry can help you trace requests as they flow through your system. Finally, use Kiali for service mesh
Mockup: when troubleshooting a component or a script that is not working with some inputs, it can be useful to mock the inputs. By providing simple and well-known inputs, you can test whether your script is processing the input as expected. This technique is especially helpful when dealing with large or complex inputs that are difficult to generate or debug.
last thing, if you did all the above-recommended steps but still you couldn't fix it, better ask one of your colleagues or co-workers for help, it's totally fine. Remember, even the most experienced face roadblocks that require a fresh perspective or a collaborative effort to overcome.
one more last thing, if your colleagues couldn't help you, StackOverflow or Github is the option, right? 😄
Conclusion
As said early in the introduction part, debugging is a mindset, at the end, you'll find the solution but how much time it took you? effort? etc. It's a skill you'll learn by resolving more issues, but it's not the end of bugs as long as you are in IT. Also, be aware of the Swiss cheese model, it will help you in risk analysis and management in your engineering tasks.
The Swiss cheese model will not only help you debugging IT problems but also help you debug your life, as it's widely used in many engineerings: aviation, civil, medical, etc.
If you like this blog leave a comment and tell me what you think and your tools for debugging. Consider subscribing for more blogs!
Cover photo from: https://www.freepik.com


