
Unlocking the Power of AIOPS with ChatGPT and Elasticsearch
AIOps with ChatGPT and Elasticsearch


Introduction
As you may have noticed, since the end of 2022 and the beginning of 2023, everyone has been talking about ChatGPT. People who have tried it, including me, have been amazed. I started using it as an assistant tool and found that it works extremely well when asking questions related to Elasticsearch. That's how I came up with the idea of combining the power of Elasticsearch, which is a highly efficient distributed system for search and indexing, with this new fantastic AI tool.
Elasticsearch
In case you don't know what is Elasticsearch, it's a distributed system designed for search and indexing, built on top of Lucene and written in Java. It is part of the ELK stack, which includes Logstash and Kibana, as well as components like Beat (metricbeat, filebeat, heartbeat, etc.), each component in the stack has a specific role:
Elasticsearch: handles search and indexing and exposes an API
Logstash: works as an ETL tool by sending data from a source to elasticsearch
Kibana: the main visualization tool for the stack
Beat: lightweight agents that collect specific data and send them to Elasticsearch
In addition, the ELK stack can be used for 3 use-cases: search, observability, and security. You can find more information on elastic.co.
Below a picture showing an overall view of the Elastic stack components:

ChatGPT
I guess you already know what is ChatGPT, but for readers who don't know it yet, here is what ChatGPT is saying about him:
You can try it from here.
AIOps with ChatGPT and Elasticsearch
Before discussing the technical aspects of ChatGPT and Elasticsearch, we must first address the topic of AIOps. According to Gartner, AIOps can be defined as:
"AIOps combines big data and machine learning to automate IT operations processes, including event correlation, anomaly detection and causality determination."
Gartner has also a list of top AIOps platforms in the market, it is updated every year: https://www.gartner.com/reviews/market/aiops-platforms.
Now let's talk technical, the question is: How can we automate an IT process with ChatGPT and Elasticsearch? Here's the answer!
Scenario
To answer the question, imagine a scenario where you have an index that contains logs of your data, those logs are related to Elasticsearch. When an error raise in your cluster, the first thing you can do is to check the error message, and there is a high chance you'll not know at the first glance why this error happened, what caused it and what's the possible solution.
The workflow is represented as follows:
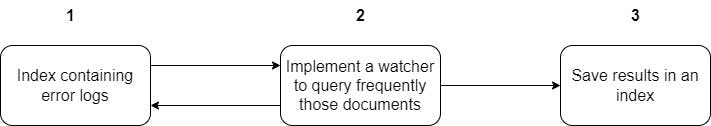
The normal routine of such an IT person is: "Just Google the damn error message", but sometimes it may take hours to figure out the reasons and understand the solution unless you already encountered and resolved the error before!

Implementation
For this blog, I picked some random StackOverflow threads related to Elasticsearch, following are URLs of StackOverflow questions:
Please be advised that this blog serves as a proposal and educational resource only. The code and solutions presented are not fully optimized for production use. Further refinement and analysis are required. Use at your own risk, as performance issues may arise if implemented in a live production environment.
In case you developed the idea and deploy it on production you can let me know or share it with the community :D, would be much appreciated!
Requirements
You need an elastic cluster up and running in case you need to test the code, you can setup your own or use the elastic cloud for a fast setup! (Personally, I use ECK, fast and easy to deploy a local cluster and works well with Docker desktop.)
You need to have an OpenAI account to use ChatGPT API. If you don't have it create one and head over to beta.openai.com/account/api-keys, to create a new API key and save it because we will need it later.
Last thing, we will use Watcher, it's part of the Elasticsearch alerting and is mainly used to track changes and anomalies in your data and apply actions (sending emails, jira requests, slack, etc.). Explaining Watcher in detail is out of the scope of this blog but check the documentation for more details. But don't worry I'll explain some parts of Watcher used!
Test ChatGPT token and access
Just make sure you run the following curl command to test access to ChatGPT API:
curl https://api.openai.com/v1/models -H 'Authorization: Bearer YOUR_API_KEY'
It should print a list of models, something like:
{
  "object": "list",
  "data": [
    {
      "id": "babbage",
      "object": "model",
      "created": 1649358449,
      "owned_by": "openai",
# ...
}
Once the curl command passes, go to OpenAI playground to test our prompts and see the output of ChatGPT. Here I used the text-davinci-003 model for this because it's powerful and has longer output, a full list of models is explained here.
Here is an output from ChatGPT about an elasticsearch error flood stage disk watermark [95%] exceeded ... all indices on this node will marked read-only:
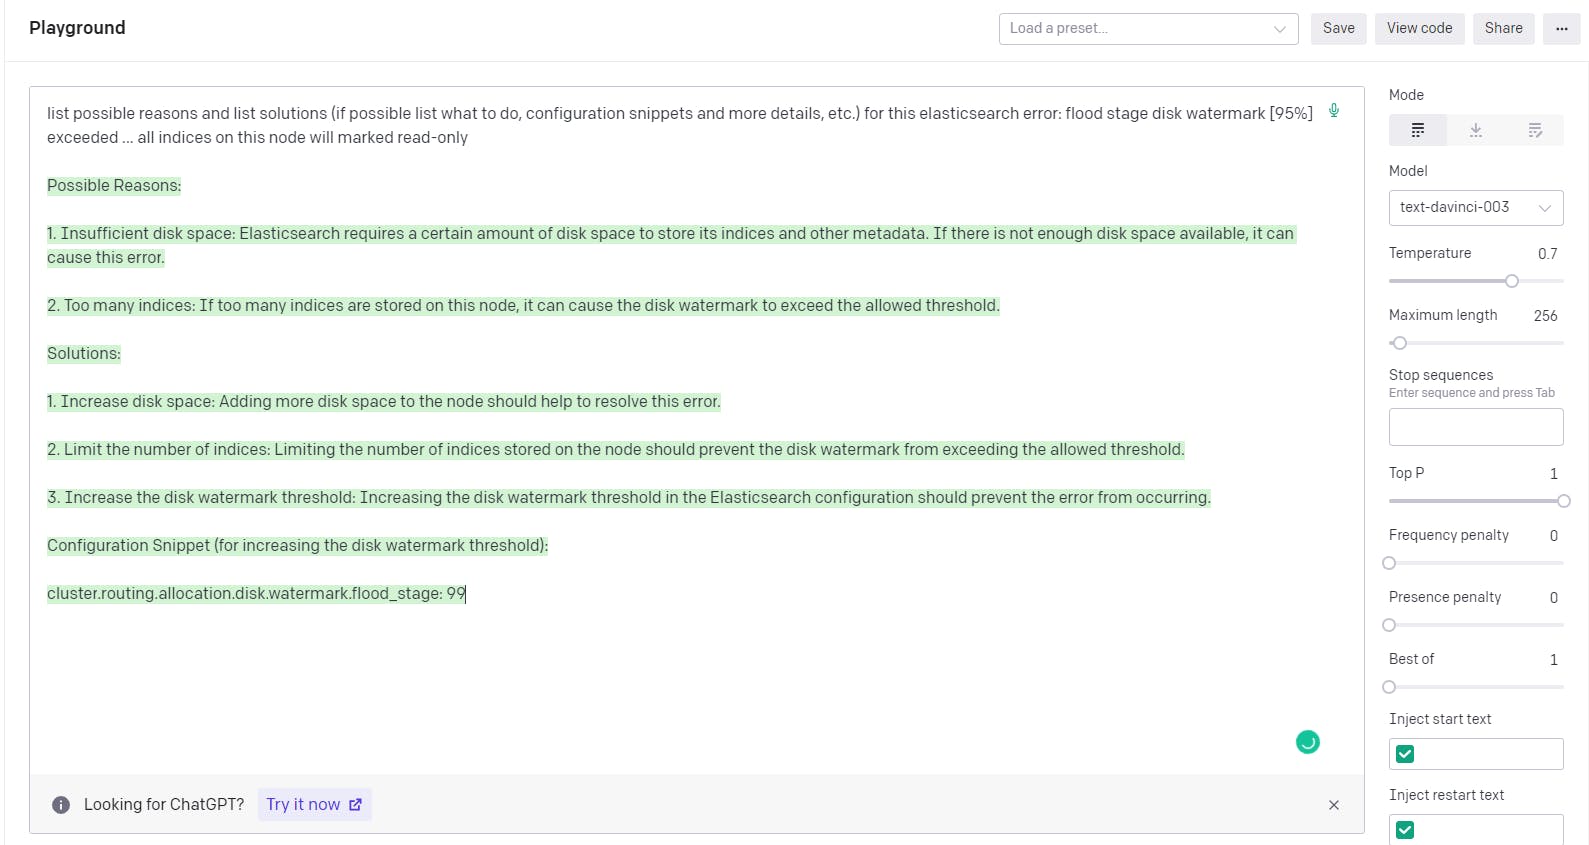
Surprisingly, ChatGPT figured out the reason of possible causes of the error, and listed possible solutions to do or to check to resolve it! Now we need to implement this using Watcher.
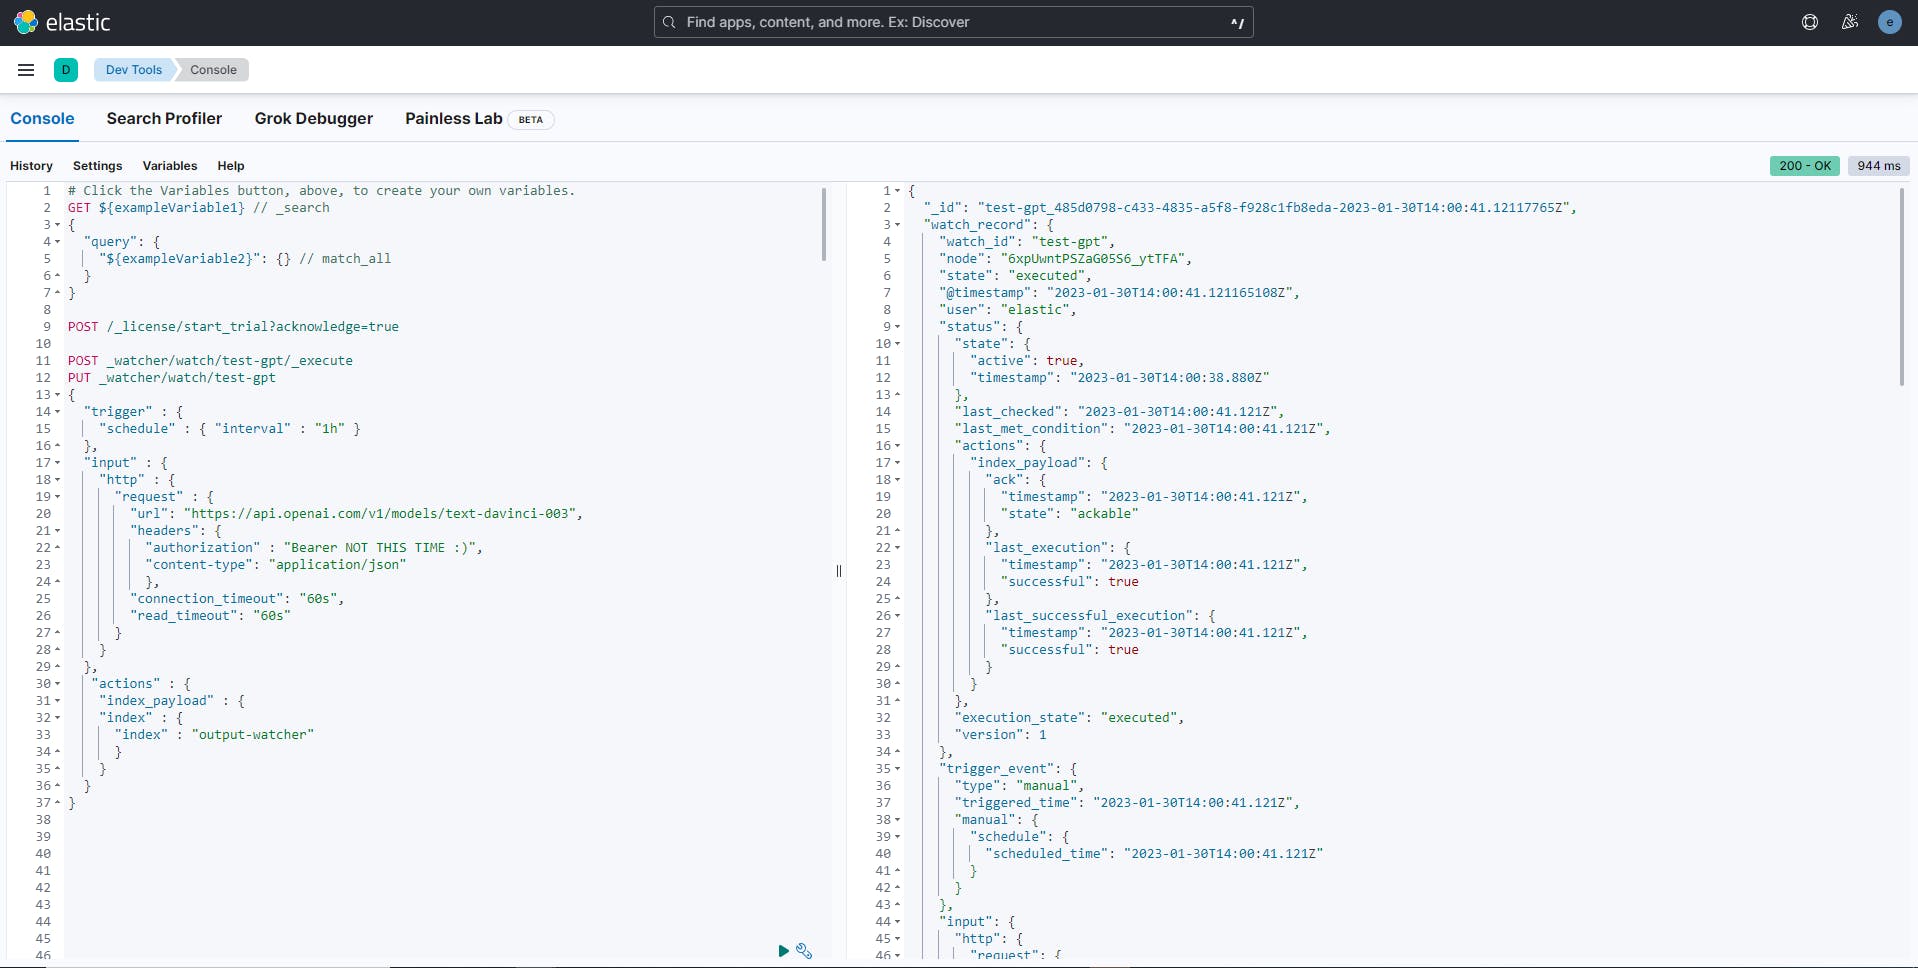
For that, go to your DevTools in Kibana at http://localhost:5601/app/dev_tools, and let's test a simple Watch http input. But before, you need to have an elastic license to use Watcher, you can activate the 30-day trial license using: POST /_license/start_trial?acknowledge=true. You'll get the following response:
{
  "acknowledged": true,
  "trial_was_started": true,
  "type": "trial"
}
The code in Watcher for the previous request executed on the OpenAI playground is:
PUT _watcher/watch/test-gpt
{
  "trigger" : {
    "schedule" : { "interval" : "1h" }
  },
  "input" : {
    "http" : {
      "request" : {
        "method": "POST",
        "url": "https://api.openai.com/v1/completions",
        "headers": {
          "authorization" : "Bearer YOUR_ACCESS_TOKEN",
          "content-type": "application/json"
          },
        "body": "{ \"model\": \"text-davinci-003\",  \"prompt\": \"list possible reasons and list solutions (if possible listwhat to do, configuration snippets and more details, etc.) for this elasticsearch error: flood stage disk watermark [95%] exceeded ... all indices on this node will marked read-only\",  \"temperature\": 1,  \"max_tokens\": 512,     \"top_p\": 1.0,      \"frequency_penalty\": 0.0,   \"presence_penalty\": 0.0 }",
        "connection_timeout": "60s",
        "read_timeout": "60s"
      }
    }
  },
   "actions" : {
    "index_payload" : {
    "index" : {
      "index" : "output-watcher"
      }
    }
  }
}
In a nutshell, the Watcher is doing the following:
1. trigger the following steps every 1 hour
2. use as input, the http input (we can call whatever api)
3. the action telling to store the result of the input in an index named 'output-watcher'
I used 1 hour in the trigger entry to not consume my quota. Once you submit the watcher code we need to execute it (we are not going to wait 1 hour), for that execute the following: POST watcher/watch/gpt/execute this will force execution and you can see many details about the state of the watcher, the output of the http input, and finally the index operation. If you are interested to check what is stored in the index run the following: GET output-watcher/_search .
Below is the result of the watcher execution:
Until now, the process is not automated. In the next step, we are going to see how to automate such a scenario by adding a little more code to our previous Watcher! (To be honest, it's not little 😁)
Take a deep breath.. at this point if you are lost take a break and come back later!

Before splashing you with the code, what we need to do is:
1. Trigger the following steps every 1 minute
2. Query the index that contains a list of the error messages happened in the last minute
3. For each error message, make an api call using http input
4. Store the result in the index 'output-watcher'
To query the error messages + make the API call, we need to use the chain input, it allows you to use and combine multiple watcher inputs and use the result of one in the other.
Now the pseudo-code is:
{
    trigger { every 1 minute },
    chain input {
      [ # <--- it's a list of inputs
        {
            query error messages
        },
        {
            make api calls for each error
        }
      ]
    },
    action {
        index the returned response
    }
}
and the code in watcher:
PUT _watcher/watch/chain-input-gpt
{
  "trigger": {
    "schedule": {
      "interval": "59s"
    }
  },
  "input": {
    "chain": {
      "inputs": [
        {
          "first": {
            "search": {
              "request": {
                "indices": [
                  "es-err"
                  ],
                  "body": {
                    "query": {
                      "range": {
                        "@timestamp": {
                          "gte": "now-1m/s",
                          "lt": "now/s"
                        }
                      }
                    }
                  }
              }
            }
          }
        },
        {
          "second": {
            "transform": {
              "script": """
              if (ctx.payload.first.hits.total > 0) return ['first_hit': ctx.payload.first.hits.hits.0._source.err_msg]
              """
            }
          }
        },
        {
          "third": {
            "http": {
              "request" : {
                "method": "POST",
                "url": "https://api.openai.com/v1/completions",
                "headers": {
                  "authorization" : "Bearer YOUR_ACCESS_TOKEN",
                  "content-type": "application/json"
                },
                "body": "{ \"model\": \"text-davinci-003\",  \"prompt\": \"list possible reasons and list solutions (if possible listwhat to do, configuration snippets and more details, etc.) for this elasticsearch error: {{ctx.payload.second.first_hit}}\",  \"temperature\": 1,  \"max_tokens\": 512,     \"top_p\": 1.0,      \"frequency_penalty\": 0.0,   \"presence_penalty\": 0.0 }",
                "connection_timeout": "60s",
                "read_timeout": "60s"
              }
            }
          }
        }
        ]
    }
  },
    "condition" : {
    "compare" : {
      "ctx.payload.first.hits.total" : {
        "gt" : 0
      }
    }
  },
  "actions": {
    "log": {
      "logging": {
        "text": "first hit to be used with chatgpt api call: {{ctx.payload.second.first_hit}}"
      }
    },
    "index_payload" : {
    "index" : {
      "index" : "output-watcher"
      }
    }
  }
}
Luckily here is some explanation:
- We used the chain input which has two inputs inside:
The first input named
first, is doing a search request against the indexes-errthat is supposed to contain some error messages and pick events that happened betweennow-1m/sandnow/s. The/sround to the nearest second, for example: ifnow=2023-01-01T12:13:45.882Z, the result ofnow/swould be2023-01-01T12:13:46.000Z. Check date math expression for more information.The second input is a
transformationtype. We are obtaining the first event from the search request. Currently, we cannot perform aforeachfunction for each event in a chain input. However, this method optimizes the number of requests and resolves subsequent errors that are related to the first error. In other words, resolving the first error leads to resolving others. We take the first element and store it in a variable called:first_hit.The third input is http input, which has the same code in it, except the
{{ctx.payload.second.first_hit}}inside the body parameter, which is the templating using mustache. Accessing an element in whatever step (input, transform, or action) in Watcher is with{{ctx.payload.YOUR_ELEMENT}}
And just before the
action, I added thecondition, which does a test that the returned search query is not empty, if it is the watcher stops the execution.The last thing is the action, as explained before we stored it in an index, and added another which is a logging action for debugging purposes. A list of possible actions can be found here.
WAIT BEFORE YOU SUBMIT THE WATCHER, WE NEED DATA FOR TEST 😄 !
Here are the StackOverflow questions to be indexed using bulk API, copy and paste in DevTools (Remember to update the @timestamp field with future values when reading this):
POST _bulk
{ "create" : { "_index" : "es-err"} }
{ "@timestamp": "2023-01-29T15:46:41.882Z", "err_msg": "cluster_block_exception [FORBIDDEN/12/index read-only / allow delete (api)];"}
{ "create" : { "_index" : "es-err"} }
{ "@timestamp": "2023-01-29T15:47:46.882Z", "err_msg": "flood stage disk watermark [95%] exceeded ... all indices on this node will marked read-only"}
{ "create" : { "_index" : "es-err"} }
{ "@timestamp": "2023-01-29T15:48:58.882Z", "err_msg": "rejected execution of org.elasticsearch.transport.TransportService$4@c8998f4 on EsThreadPoolExecutor[bulk, queue capacity = 50, org.elasticsearch.common.util.concurrent.EsThreadPoolExecutor@553aee29[Running, pool size = 4, active threads = 4, queued tasks = 50, completed tasks = 0]]"}
{ "create" : { "_index" : "es-err"} }
{ "@timestamp": "2023-01-29T15:49:12.882Z", "err_msg": "[2022-12-26T17:55:47,141][WARN ][o.e.x.s.t.n.SecurityNetty4HttpServerTransport] [DESKTOP-VLBL46H] received plaintext http traffic on an https channel, closing connection Netty4HttpChannel{localAddress=/[0:0:0:0:0:0:0:1]:9200, remoteAddress=/[0:0:0:0:0:0:0:1]:60933}"}
{ "create" : { "_index" : "es-err"} }
{ "@timestamp": "2023-01-29T15:50:23.882Z", "err_msg": "not enough master nodes [[]]"}
Once you index the above documents, apply the Watcher code, wait a few minutes and you'll see in the Watcher management app (localhost:5601/app/management/insightsAndAl..) your watcher execution history and result:

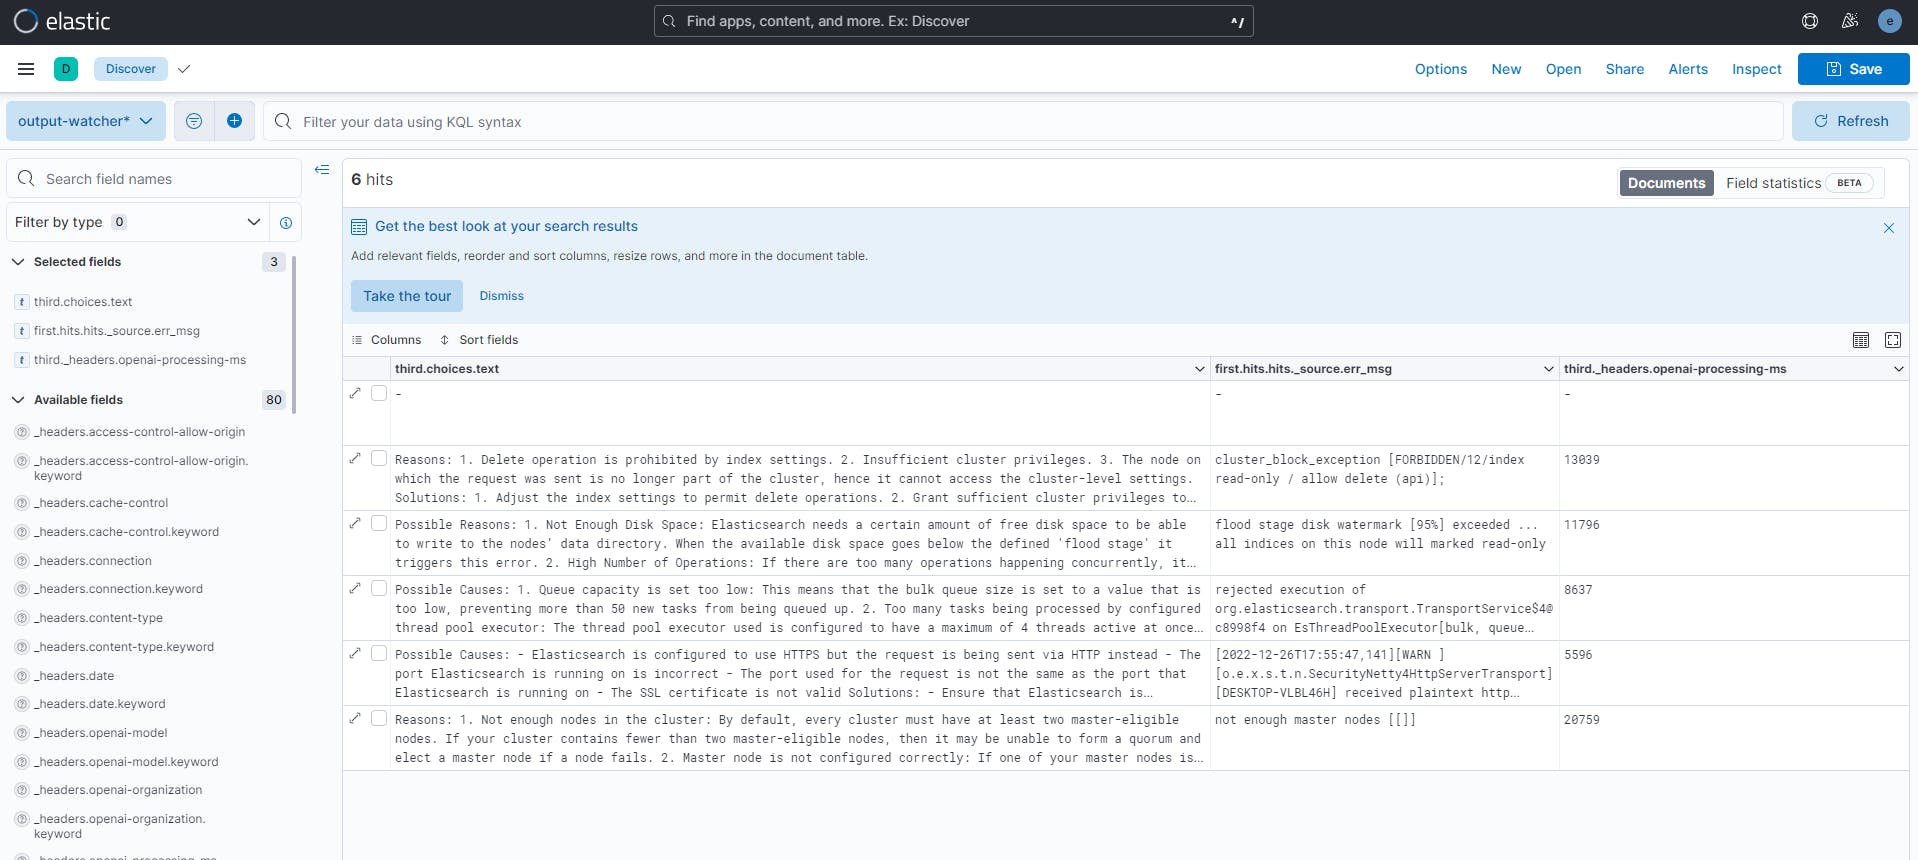
Finally, create an index pattern for the index output-watcher and go to the Discover app to see its content. I picked the following fields to display a table:
third.choices.text: is the content of the response returned by ChatGPTfirst.hits.hits._source.err_msg: the initial error messagethird._headers.openai-processing-ms: the time in (ms) took for the ChatGPT api to respond. Notice it takes a considerable time, this is why I set theconnection_timeoutto60sin the http input.
And following is a summary and full text of what ChatGPT answered for each question:
| Error message | ChatGPT response |
| rejected execution of org.elasticsearch.transport.TransportService$4@c8998f4 on EsThreadPoolExecutor[bulk, queue capacity = 50, org.elasticsearch.common.util.concurrent.EsThreadPoolExecutor@553aee29[Running, pool size = 4, active threads = 4, queued tasks = 50, completed tasks = 0]] | Possible Causes: 1. Queue capacity is set too low: This means that the bulk queue size is set to a value that is too low, preventing more than 50 new tasks from being queued up. 2. Too many tasks being processed by configured thread pool executor: The thread pool executor used is configured to have a maximum of 4 threads active at once, meaning that it can only process a limited amount of tasks. Solutions: 1. Increase the queue capacity: Increase the queue capacity for the bulk queue by increasing the queue size to a value that is high enough to accommodate for all of your tasks. 2. Increase the number of threads allocated to the thread pool executor: Increase the maximum number of threads allocated to the thread pool executor to allow for more tasks to be processed in parallel. You can do this by modifying the configuration option 'threads' on the elasticsearch.yml file or alternatively by using the cluster update settings API. |
| not enough master nodes [[]] | Reasons: 1. Not enough nodes in the cluster: By default, every cluster must have at least two master-eligible nodes. If your cluster contains fewer than two master-eligible nodes, then it may be unable to form a quorum and elect a master node if a node fails. 2. Master node is not configured correctly: If one of your master nodes is incorrectly configured for election, then it may cause the cluster to become unresponsive and unable to elect a master node. Solutions: 1. Check that all of your master-eligible nodes are in, and wait for them to reach a Green status. 2. Check the /_cat/master output to make sure all nodes are eligible with the master in. 3.If not, you may need to update the node configuration by adding the following to the elasticsearch.yml of the master-eligible node(s): node.master: true node.data: false 4. Once the configuration changes have been made, restart the node so the new settings take effect. 5. Finally, check the cluster health again and verify that it is stable. |
| cluster_block_exception [FORBIDDEN/12/index read-only / allow delete (api)]; | Reasons: 1. Delete operation is prohibited by index settings. 2. Insufficient cluster privileges. 3. The node on which the request was sent is no longer part of the cluster, hence it cannot access the cluster-level settings. Solutions: 1. Adjust the index settings to permit delete operations. 2. Grant sufficient cluster privileges to the node making the request. For example, set the "cluster:admin/indices/delete" privilege on that node. 3. Make sure the node is part of the cluster by its registered cluster name in the "cluster.name" configuration setting. If the node is part of the cluster, check the cluster state to ensure it is healthy. |
| [2022-12-26T17:55:47,141][WARN ][o.e.x.s.t.n.SecurityNetty4HttpServerTransport] [DESKTOP-VLBL46H] received plaintext http traffic on an https channel, closing connection Netty4HttpChannel{localAddress=/[0:0:0:0:0:0:0:1]:9200, remoteAddress=/[0:0:0:0:0:0:0:1]:60933} | Possible Causes: - Elasticsearch is configured to use HTTPS but the request is being sent via HTTP instead - The port Elasticsearch is running on is incorrect - The port used for the request is not the same as the port that Elasticsearch is running on - The SSL certificate is not valid Solutions: - Ensure that Elasticsearch is configured to use HTTPS and that requests are also sent using HTTPS instead of HTTP - Verify the port that Elasticsearch is running on and make sure the request is sent using that port - Install a valid SSL certificate so that requests and responses are encrypted correctly |
| flood stage disk watermark [95%] exceeded ... all indices on this node will marked read-only | Possible Reasons: 1. Not Enough Disk Space: Elasticsearch needs a certain amount of free disk space to be able to write to the nodes’ data directory. When the available disk space goes below the defined 'flood stage' it triggers this error. 2. High Number of Operations: If there are too many operations happening concurrently, it can overwhelm the node’s capacity and cause it to become unresponsive. Solutions: 1. Free Up Disk Space: Increase the available disk space by either deleting some unneeded indices or expanding the disk space by adding more nodes or hard disks. 2. Balance the Workload: If possible, try spreading the workload across more nodes or limit the number of concurrent operations happening on each node. Configuration Snippets: • Increase the watermark by changing the value in the config file (e.g. path.repo: '/path/to/elasticsearch/data/repository'): cluster.routing.allocation.disk.watermark.low: 95 (change this to higher value) • Limit the number of concurrent operations on each node by setting max_concurrent_shard_requests: cluster.max_concurrent_shard_requests: 32 (change to any other suitable number) |
Analyzing results
Comparing results from the table, and as an Elastic user, we see that ChatGPT performed extremely well, by providing detailed root causes and answers. To figure it out on your own, perhaps, it may take several minutes or even hours of searching through documentation and results from Google.
The last column from Kibana UI displays the amount of time the ChatGPT API took to respond, compared to the typical API response time of a few milliseconds. It can be explained because we are not requesting static data as a normal API. However, this may improve in the future as OpenAI servers are currently handling high demand.
Conclusion
Based on what we can do with ChatGPT and Elasticsearch, we can conclude the following Pros and Cons:
Pros
ChatGPT works well with Elasticsearch when it comes to finding answers about complex problems related to troubleshooting a root cause of a cluster failure
ChatGPT can be used as an assistant in your day-to-day engineering tasks, this will improve your productivity
This scenario can be used for any Observability use case and will help L1/L2 support in quickly obtaining information regarding any issues
It can be extended for other tools to provide and enrich errors with possible causes and solutions because Elasticsearch supports many integrations
You can fine-tune your model with ChatGPT for more precise results
Cons
As detailed earlier, Watcher doesn't support a
foreachfunction for each element returned from an input (at the time of writing this)ChatGPT's knowledge is static and may not reflect recent updates or changes to technologies, such as a major update to Elasticsearch. As a result, its responses may not be completely accurate
Finally I hope you learned something related to Watcher, combine multiple inputs using chain-input and multiple actions.
⚠️ Once you are done, don't forget to deactivate or delete the Watcher ! ⚠️
That's it for this blog 😊, if you liked it you can share it with your friends and let me know your feedback in the comments below 👇!
Cover photo from: pexels.com/fr-fr/photo/jambes-technologie-d..